Free Access
Fig. 8
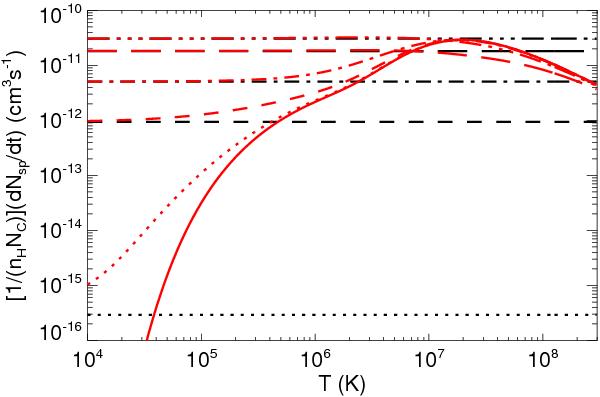
Erosion rate for an a-C:H grain of radius 130 nm for different drift velocities between the projectiles and the target grain. Red lines represent the erosion rate computed using the skewed Maxwellian distribution while black lines with the inertial sputtering formulation. The line style coding is the same as for Fig. 7.
Current usage metrics show cumulative count of Article Views (full-text article views including HTML views, PDF and ePub downloads, according to the available data) and Abstracts Views on Vision4Press platform.
Data correspond to usage on the plateform after 2015. The current usage metrics is available 48-96 hours after online publication and is updated daily on week days.
Initial download of the metrics may take a while.