Fig. 6
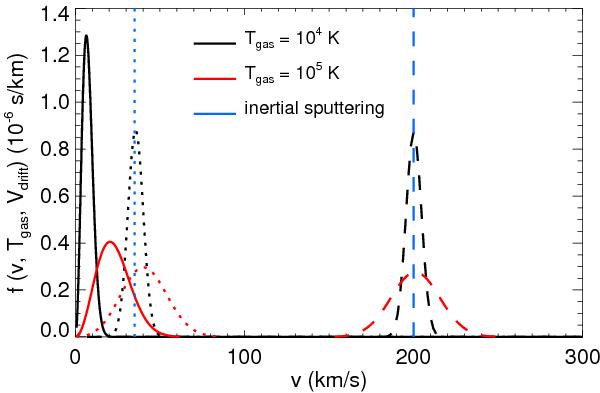
Skewed Maxwellian distribution as a function of the relative velocity between a grain and the gas for different drift velocities and gas temperatures. Solid lines show the case of Vdrift = 0 km s-1, dotted lines the case of Vdrift = 35 km s-1 and dashed lines the case of Vdrift = 200 km s-1. Black lines are for a gas temperature Tgas = 104 K, red lines are for Tgas = 105 K and the blue lines represent the inertial sputtering.
Current usage metrics show cumulative count of Article Views (full-text article views including HTML views, PDF and ePub downloads, according to the available data) and Abstracts Views on Vision4Press platform.
Data correspond to usage on the plateform after 2015. The current usage metrics is available 48-96 hours after online publication and is updated daily on week days.
Initial download of the metrics may take a while.