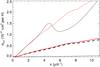
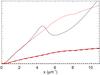
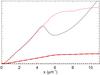
Fig. 17
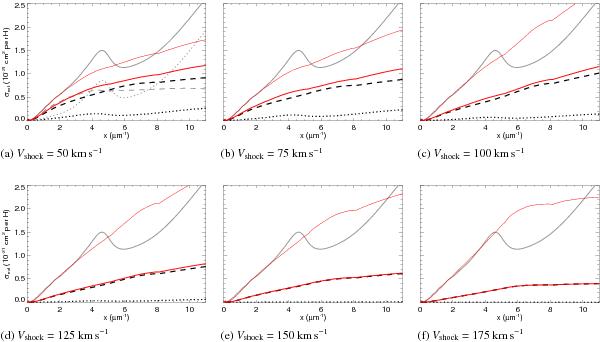
Post-shock NIR-UV dust extinction as a function of shock velocity. The colour- and line style-coding are as per Fig. 16. The 200 km s-1 case is almost identical to that of the 175 km s-1 shock and is therefore not shown here. The thin red lines show the post-shock extinction normalised to the V-band pre-shock extinction. For Vshock = 50 km s-1 the pre-shock dust extinction due to carbonaceous (grey dotted line) and silicate (grey dashed line) grains is shown.
Current usage metrics show cumulative count of Article Views (full-text article views including HTML views, PDF and ePub downloads, according to the available data) and Abstracts Views on Vision4Press platform.
Data correspond to usage on the plateform after 2015. The current usage metrics is available 48-96 hours after online publication and is updated daily on week days.
Initial download of the metrics may take a while.