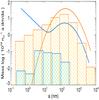
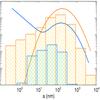
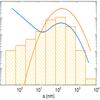
Fig. 15
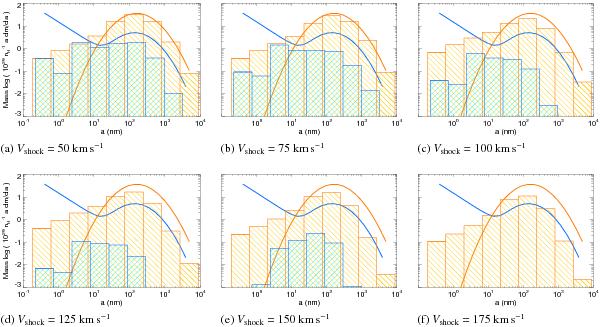
Post-shock size distribution for different shock velocities. The post-shock distribution is divided into 9 bins while the solid lines represent the pre-shock distribution; carbonaceous (blue) and silicate (orange). The 200 km s-1 post-shock size distribution is almost identical to the case of a 175 km s-1 shock, and is therefore not shown here.
Current usage metrics show cumulative count of Article Views (full-text article views including HTML views, PDF and ePub downloads, according to the available data) and Abstracts Views on Vision4Press platform.
Data correspond to usage on the plateform after 2015. The current usage metrics is available 48-96 hours after online publication and is updated daily on week days.
Initial download of the metrics may take a while.