Fig. 2
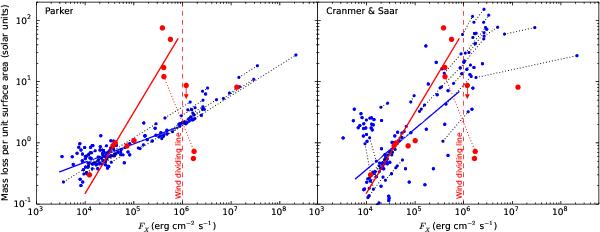
Mass-loss rates per unit surface area as a function of X-ray flux for the Parker (left) and CS (right) models are plotted in blue. Values for these mass-loss rates can be found in Appendix A. The mass-loss rates and the wind dividing line of Wood et al. (2014) are overplotted in red (see their Fig. 4). These authors fit a power law (red solid line),  , to their data points below the wind dividing line. For our data, we find power laws of
  and
and  for the Parker and CS models respectively (solid blue lines). If we use our entire sample, we find
  and
and  respectively. We note that our quoted errors are in the fit only.
Current usage metrics show cumulative count of Article Views (full-text article views including HTML views, PDF and ePub downloads, according to the available data) and Abstracts Views on Vision4Press platform.
Data correspond to usage on the plateform after 2015. The current usage metrics is available 48-96 hours after online publication and is updated daily on week days.
Initial download of the metrics may take a while.