Fig. 1
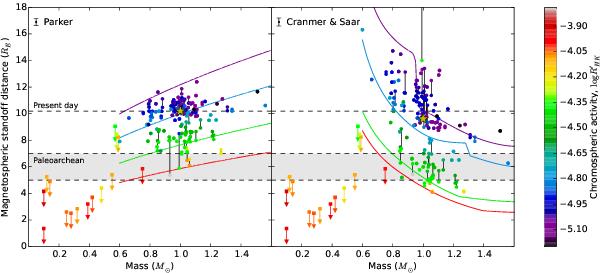
Magnetospheric size as a function of host star mass for the Parker (left) and CS (right) wind models. The Bcool sample of solar-type stars is plotted with circles and the Sun is indicated by a star symbol. Values for these standoff distances can be found in Appendix A. Typical errorbars for this sample are indicated in the upper left of each panel. The magnetospheric sizes computed assuming constant activity,  , are plotted as solid lines. These correspond to chromospheric ages of 8.4, 3.2, 0.3, 0.008 Gyr respectively. We note that the Earth developed an oxygen rich atmosphere near 1.5 Gyr which corresponds to a solar chromospheric activity of
  . The upper limit for magnetospheric sizes as calculated by Vidotto et al. (2013), for a sample of M dwarfs, are plotted with squares. All points and curves are colour coded by chromospheric activity. The upper dashed line indicates the present day magnetosphere size and the shaded area indicates a range of possible Paleoarchean magnetosphere sizes.
Current usage metrics show cumulative count of Article Views (full-text article views including HTML views, PDF and ePub downloads, according to the available data) and Abstracts Views on Vision4Press platform.
Data correspond to usage on the plateform after 2015. The current usage metrics is available 48-96 hours after online publication and is updated daily on week days.
Initial download of the metrics may take a while.