Fig. 14
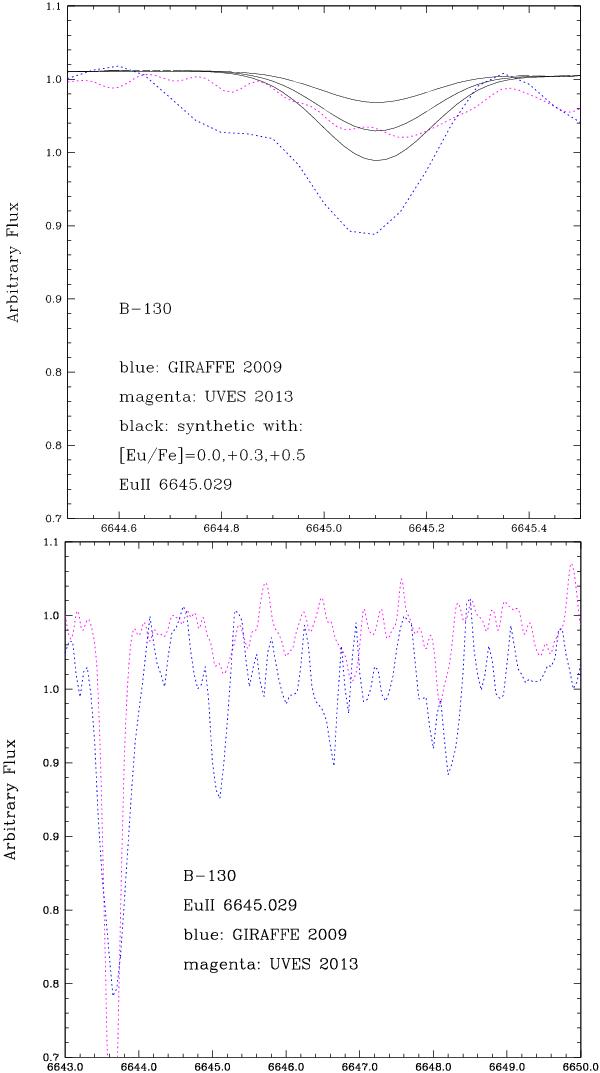
Eu ii 6645 Å line in the same star B-130, shown in spectra of UVES from the present work, observed in 2011−2012, and in the GIRAFFE spectrum studied in B09. Upper panel: Eu ii 6645 Å line; lower panel: the same spectral region enlarged. The magenta dotted line represents the UVES spectrum, the blue dotted line the GIRAFFE spectrum, and the blue solid lines plot the synthetic spectra computed with [Eu/Fe] = 0, +0.3, +0.5.
Current usage metrics show cumulative count of Article Views (full-text article views including HTML views, PDF and ePub downloads, according to the available data) and Abstracts Views on Vision4Press platform.
Data correspond to usage on the plateform after 2015. The current usage metrics is available 48-96 hours after online publication and is updated daily on week days.
Initial download of the metrics may take a while.