Fig. 9
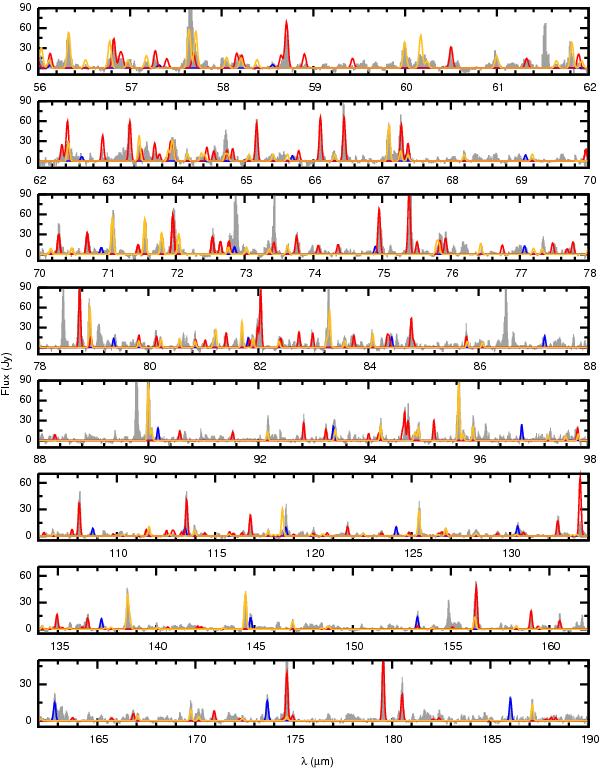
PACS spectrum (represented by the grey-filled histogram) compared to our best model, with the parameters given in Table 1 but with υturb of 0.7 km s-1 and with ortho- and para-H O abundances of 6 × 10⁻⁴ and 3 × 10⁻⁴, respectively. The 12CO model is shown by the full-blue line, the ortho-HO, by the full-red line and the para-HO, by the full-yellow line.
Current usage metrics show cumulative count of Article Views (full-text article views including HTML views, PDF and ePub downloads, according to the available data) and Abstracts Views on Vision4Press platform.
Data correspond to usage on the plateform after 2015. The current usage metrics is available 48-96 hours after online publication and is updated daily on week days.
Initial download of the metrics may take a while.