Fig. 8
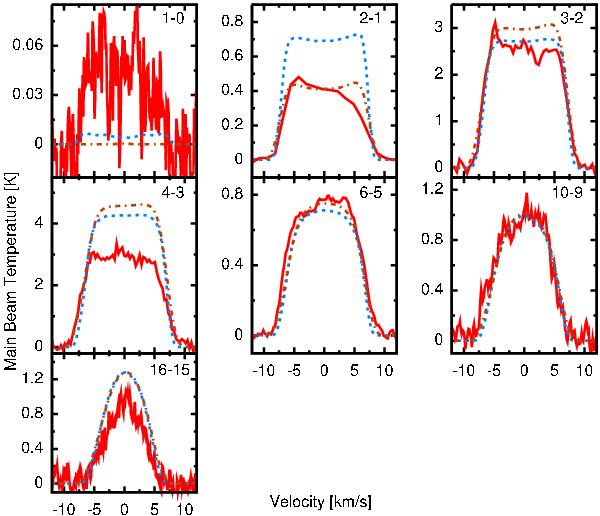
A model for the 12CO lines with υturb = 0.7 km s-1 (short-dashed blue line) is compared to the best model found in Paper I (υturb = 1.4 km s-1; dotted-dashed brown line). The observed 12CO lines are shown in red. The adopted value for the υLSR of 40.4 km s-1 was subtracted from the observed lines. The lines J = 16 − 15, 10 − 9 and 6 − 5 were observed with HIFI, J = 4 − 3 and 3 − 2 with APEX, J = 2 − 1 with SMT and J = 1 − 0 with SEST.
Current usage metrics show cumulative count of Article Views (full-text article views including HTML views, PDF and ePub downloads, according to the available data) and Abstracts Views on Vision4Press platform.
Data correspond to usage on the plateform after 2015. The current usage metrics is available 48-96 hours after online publication and is updated daily on week days.
Initial download of the metrics may take a while.