Fig. 7
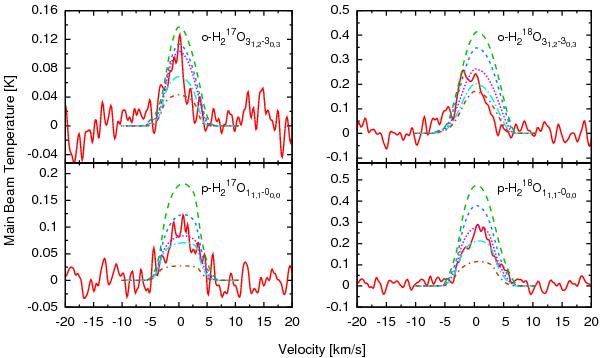
The solid red line represents the HIFI data, the dashed green, short-dashed blue, dotted purple, dashed-dotted light-blue and short-dashed-dotted brown lines represent, respectively, models with abundances relatively to H2 of: (4, 2, 1.2, 0.4, 0.2) × 10-6 for for ortho-H O; (1.2, 0.8, 0.4, 0.2, 0.12) × 10-4 for ortho-H
 O; (8, 4, 2, 1.2, 0.4) × 10-7 for para-HO; and (8, 4, 2, 1.2, 0.4) × 106 for para-HO. We adopted a value of 0.7 km s-1 for the turbulence velocity in these calculations. The adopted value for the υLSR of 40.4 km s-1 was subtracted from the observed lines.
Current usage metrics show cumulative count of Article Views (full-text article views including HTML views, PDF and ePub downloads, according to the available data) and Abstracts Views on Vision4Press platform.
Data correspond to usage on the plateform after 2015. The current usage metrics is available 48-96 hours after online publication and is updated daily on week days.
Initial download of the metrics may take a while.