Fig. 3
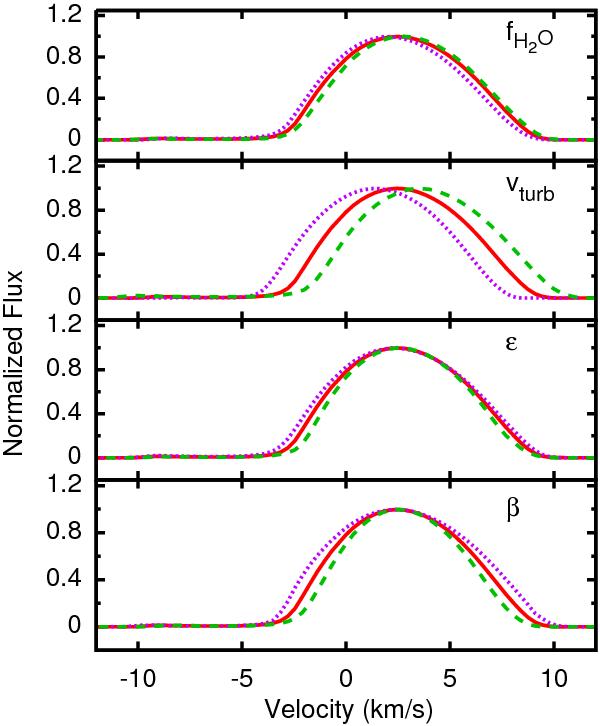
Effects of varying the H O abundance, the turbulence velocity, the temperature power law exponent and the velocity power law exponent on the normalized line strength are shown for o-HO (11,0 − 10,1). The standard model is represented by the red line in each panel, it has its values given in Table 1 and fH2O = 4 × 10⁻⁴. The short-dashed purple and the long-dashed green represent models with respectively: fH2O = 1 × 10⁻⁴ and 1.6 × 10⁻³ in the first panel; υturb = 0.8 and 2.0 km s-1 in the second panel; ϵ = 0.2 and 1.1 in the third panel; and β = 1.5 and 10 in the fourth panel. All other parameters have the same value as the standard model. We note that varying υturb has the effect of a line shift.
Current usage metrics show cumulative count of Article Views (full-text article views including HTML views, PDF and ePub downloads, according to the available data) and Abstracts Views on Vision4Press platform.
Data correspond to usage on the plateform after 2015. The current usage metrics is available 48-96 hours after online publication and is updated daily on week days.
Initial download of the metrics may take a while.