Fig. 5
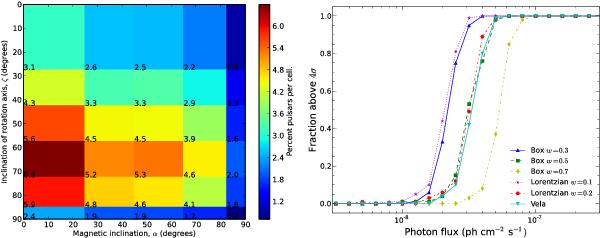
Left: same gridding in inclination ζ and magnetic inclination α as in the Atlas of gamma-ray profile shapes of Romani & Watters (Fig. 15, 2010). The occupancy fractions assume uniform distributions in α and cosζ. Right: fraction of simulated lightcurves exceeding 4σ with the H-test, as a function of pulsar flux above 100 MeV, for a fixed background intensity, for different profile shapes. w is the gap width defined in the text.
Current usage metrics show cumulative count of Article Views (full-text article views including HTML views, PDF and ePub downloads, according to the available data) and Abstracts Views on Vision4Press platform.
Data correspond to usage on the plateform after 2015. The current usage metrics is available 48-96 hours after online publication and is updated daily on week days.
Initial download of the metrics may take a while.