Fig. 4
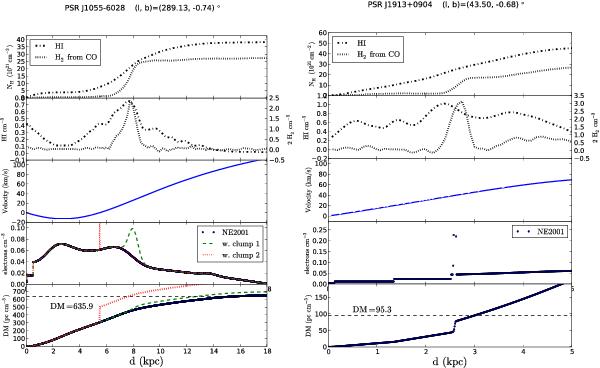
Diagnostics for DM distances obtained using the NE2001 model, for PSRs J1055−6028 (left) and J1913+0904 (right). Counting from the top, the second frame shows the proton densities along the line of sight of the pulsar derived from the LAB survey HI brightness temperature Tb (left axis), and from the Dame et al. (2001) CO survey brightness temperature (right axis). The radial velocity from the surveys has been translated to a distance (x-axis for all frames) using a flat rotation curve (third frame). The top frame shows the proton densities integrated into column densities. The fourth frame is the electron density used by NE2001, integrated to give DM in the fifth frame (the spikes exceed the y-scale). See text for a discussion of the clumps added to the NE2001 model for J1055−6028.
Current usage metrics show cumulative count of Article Views (full-text article views including HTML views, PDF and ePub downloads, according to the available data) and Abstracts Views on Vision4Press platform.
Data correspond to usage on the plateform after 2015. The current usage metrics is available 48-96 hours after online publication and is updated daily on week days.
Initial download of the metrics may take a while.