Fig. 3
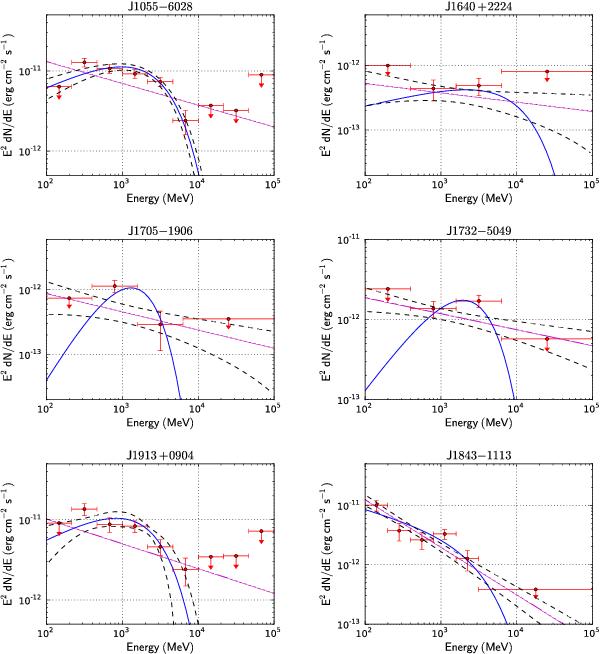
Spectral energy distributions for the three young pulsars (left) and the three millisecond pulsars (right). The solid straight lines are the power-law fits, whereas the solid curves show the exponentially cut off power laws. The dashed curves show the 95% confidence level uncertainties for the fits reported in Table 1. The data points are described in the text.
Current usage metrics show cumulative count of Article Views (full-text article views including HTML views, PDF and ePub downloads, according to the available data) and Abstracts Views on Vision4Press platform.
Data correspond to usage on the plateform after 2015. The current usage metrics is available 48-96 hours after online publication and is updated daily on week days.
Initial download of the metrics may take a while.