Fig. 1
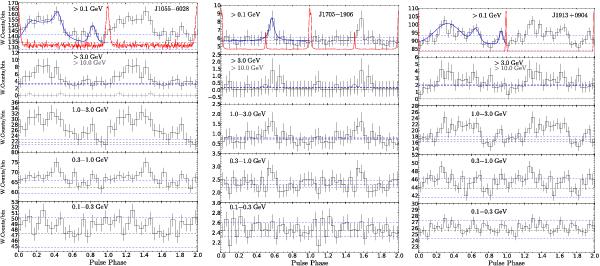
Gamma-ray pulse profiles (black histograms) for the young pulsars PSR J1055−6028 (left), J1705−1906 (middle), and J1913+0904 (right). Each gamma-ray event is weighted, and the error bars are explained in Sect. 2.2. The horizontal dotted lines are the background levels, with ±1σ uncertainties. Each pulsar rotation is shown twice. Fits to the light curves overlay the histogram for phases 0 to 1 (blue in the electronic version), and the phase-aligned ~1.4 GHz radio profiles are also shown (red curves).
Current usage metrics show cumulative count of Article Views (full-text article views including HTML views, PDF and ePub downloads, according to the available data) and Abstracts Views on Vision4Press platform.
Data correspond to usage on the plateform after 2015. The current usage metrics is available 48-96 hours after online publication and is updated daily on week days.
Initial download of the metrics may take a while.