Fig. 3
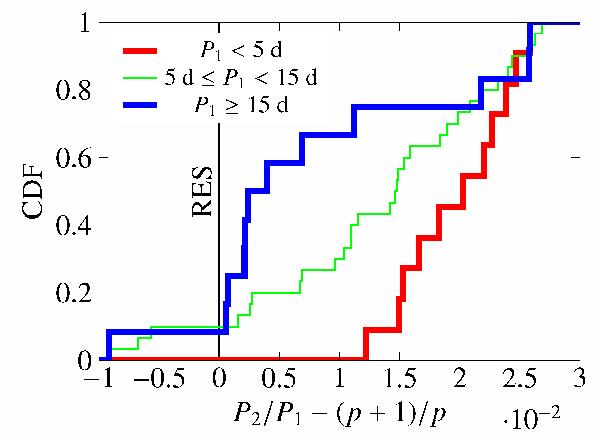
Cumulative distributions of planet pairs in the vicinity of the 2:1 and 3:2 mean-motion resonances (the statistics of both resonances are accumulated) for the three groups defined in Fig. 2 (see also Sect. 2) Using K-S tests to compare these distributions, we obtain p-values of 0.08% (red and blue distributions), 10% (blue and green), and 3.5% (green and red). See text for discussion.
Current usage metrics show cumulative count of Article Views (full-text article views including HTML views, PDF and ePub downloads, according to the available data) and Abstracts Views on Vision4Press platform.
Data correspond to usage on the plateform after 2015. The current usage metrics is available 48-96 hours after online publication and is updated daily on week days.
Initial download of the metrics may take a while.