Fig. 2
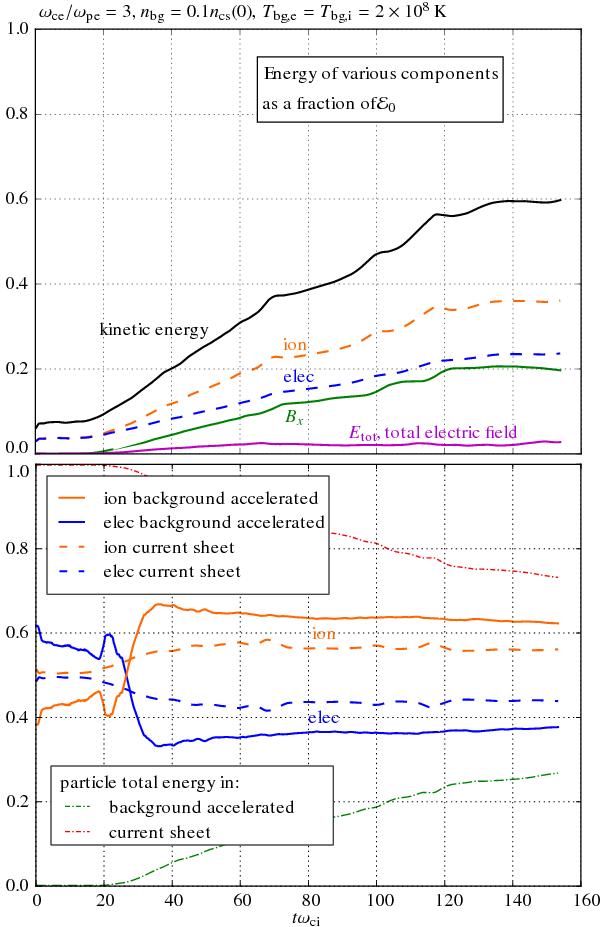
Energy distribution for the main simulation (Sect. 3.1), with a background magnetization for ions and electrons  , respectively. Top: energy in the total electric field Etot, in the x component of the magnetic field, and in the particles (also decomposed into the ion and electron contributions). These energies are computed on a fixed area that corresponds to the location of the background particles, or field lines, that reach the current sheet before the end of the simulation. The total initial energy in this area is ℰ0. We note that the energy in Etot is mostly the energy in the y component Ey. Also, the energy of By is 0.5% of the energy of Bx. Bottom: orange and blue curves are the energy distribution between ions and electrons for the current sheet particles (dashed), and for the background particles that have been accelerated (solid). They are normalized so that their sum is 1. The red and green curve show the energy repartition between current sheet particles and background accelerated particles.
Current usage metrics show cumulative count of Article Views (full-text article views including HTML views, PDF and ePub downloads, according to the available data) and Abstracts Views on Vision4Press platform.
Data correspond to usage on the plateform after 2015. The current usage metrics is available 48-96 hours after online publication and is updated daily on week days.
Initial download of the metrics may take a while.