Fig. 1
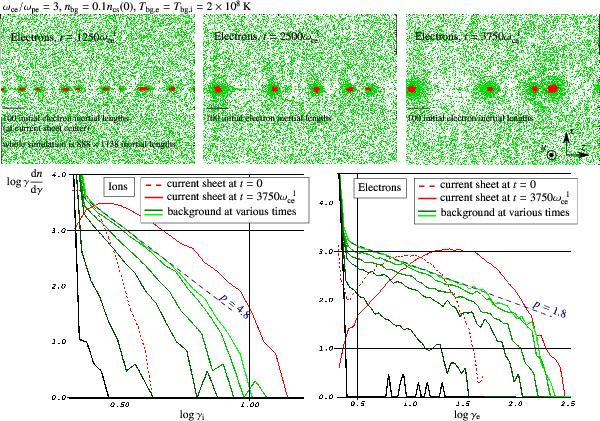
Data from the main simulation (Sect. 3.1), with a background magnetization respectively for ions and electrons  . Top: snapshots of a random selection of electrons in the whole simulation domain. Red particles are inside the current sheet at t = 0, green ones are outside. Bottom: Lorentz factor distributions. Red (green) curves concern the red (green) population. For the green curves, times are ordered as dark to light green, with values 0, 750, 1500, 2250, 3000, 3750
 , i.e., one curve every
  . The blue dashed line indicates the final power-law slope of the background accelerated particles.
Current usage metrics show cumulative count of Article Views (full-text article views including HTML views, PDF and ePub downloads, according to the available data) and Abstracts Views on Vision4Press platform.
Data correspond to usage on the plateform after 2015. The current usage metrics is available 48-96 hours after online publication and is updated daily on week days.
Initial download of the metrics may take a while.