Fig. 9
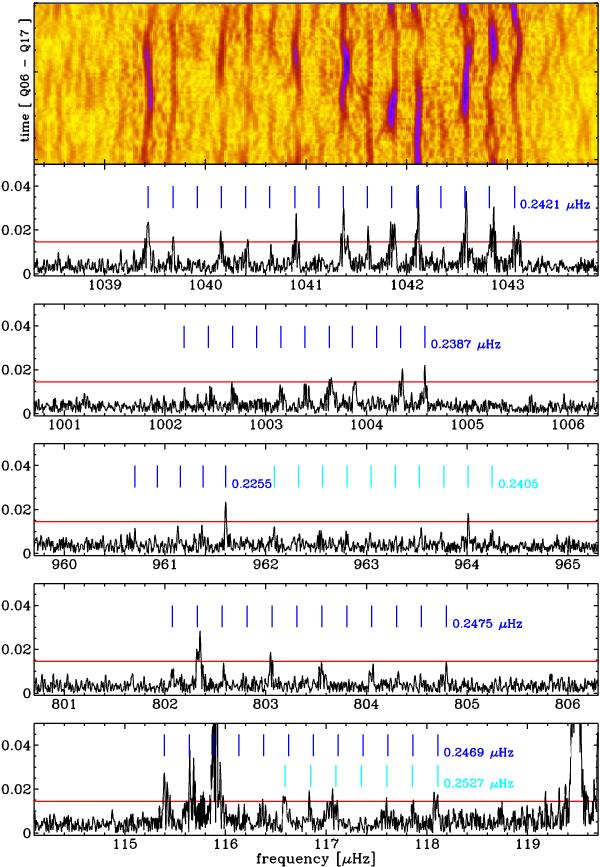
Selected regions in Fourier space where large multiplets occur, indicative of ℓ> 2. The Fourier amplitudes are given in units of ppt; the red line reflects our adopted detection limit. For each apparent sequence of modes, a grid of vertical lines is drawn with an indicated average splitting based on the frequencies of the first and last clear mode in the sequence. The bottom panel shows either a chance alignment of an ℓ = 2 and an ℓ = 3 multiplet, or a single multiplet of ℓ ≥ 6. The 802−805 μHz structure could be an ℓ ≥ 6 multiplet. The 1002−1004 μHz structure could be an ℓ ≥ 5 multiplet. For the 1039−1043 μHz structure, which is consistent with an ℓ ≥ 8 multiplet, the dynamic Fourier transform as a function of time is shown; for this a sliding window of 200 days was used. Note that all frequency splittings of these ℓ> 2 modes are very similar in value.
Current usage metrics show cumulative count of Article Views (full-text article views including HTML views, PDF and ePub downloads, according to the available data) and Abstracts Views on Vision4Press platform.
Data correspond to usage on the plateform after 2015. The current usage metrics is available 48-96 hours after online publication and is updated daily on week days.
Initial download of the metrics may take a while.