Fig. 7
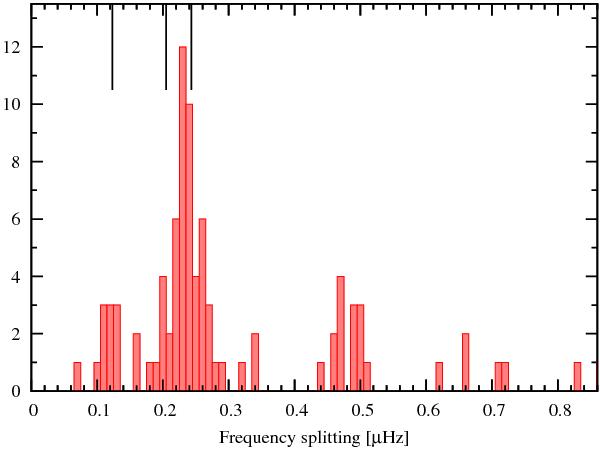
Histogram of frequency splittings listed in Table A.3, that are determined by taking the frequency difference between subsequent entries in the sorted frequency list. The vertical indicators at 0.123 μHz, 0.205 μHz, and 0.243 μHz, reflect expected ℓ = 1, 2, 8 splittings for a rotation period of 47 days. The splittings at 0.13 μHz are identified as ℓ = 1, and the peak at 0.23 μHz as ℓ ≥ 2 modes.
Current usage metrics show cumulative count of Article Views (full-text article views including HTML views, PDF and ePub downloads, according to the available data) and Abstracts Views on Vision4Press platform.
Data correspond to usage on the plateform after 2015. The current usage metrics is available 48-96 hours after online publication and is updated daily on week days.
Initial download of the metrics may take a while.