Free Access
Fig. 6
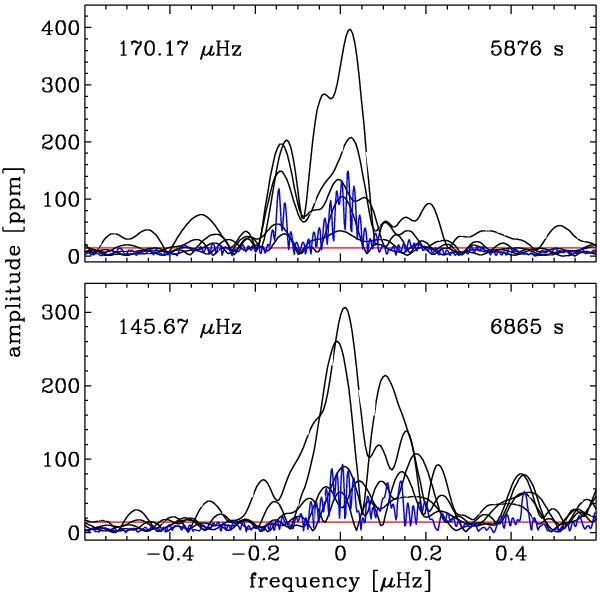
Wide-peaked ℓ = 1 doublets in the Fourier Transform of the Q06–Q17 data set (blue). The black curves are FTs of the five ~210-day subsets of the data, which show the amplitude variability of these modes. The red horizontal line marks the 4.5σ limit. The doublet spacings are consistent with those in Fig. 5.
Current usage metrics show cumulative count of Article Views (full-text article views including HTML views, PDF and ePub downloads, according to the available data) and Abstracts Views on Vision4Press platform.
Data correspond to usage on the plateform after 2015. The current usage metrics is available 48-96 hours after online publication and is updated daily on week days.
Initial download of the metrics may take a while.