Fig. 3
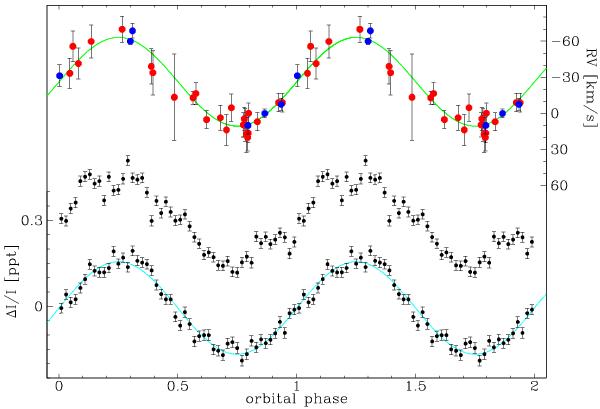
Bottom: first half of the 2.8 year long Kepler light curve from quarters Q06 through Q16, folded on the orbital period and binned into 50 bins, with a model fit as listed in Table 4. Middle: folded second half of the light curve, offset by 0.3 ppt for clarity. The structure in this curve relates to imperfect detrending around gaps in the light curve. Top: phased radial velocities from the spectra from the Nordic Optical (red dots) and William Herschel (blue dots) telescopes.
Current usage metrics show cumulative count of Article Views (full-text article views including HTML views, PDF and ePub downloads, according to the available data) and Abstracts Views on Vision4Press platform.
Data correspond to usage on the plateform after 2015. The current usage metrics is available 48-96 hours after online publication and is updated daily on week days.
Initial download of the metrics may take a while.