Fig. 10
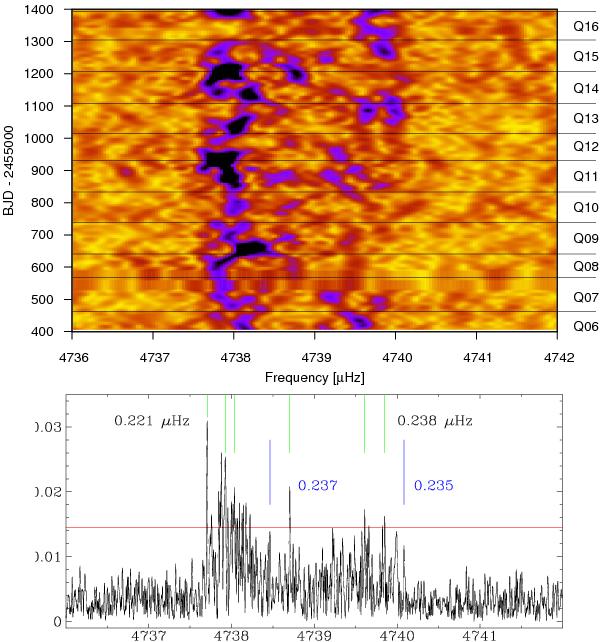
p-mode complex at 4739 μHz. Top: dynamic Fouriertransform computed with a running window of 50 days. The colour cuts range from 0 to 0.08 ppt. Bottom: FT of the full Q06–Q17 Kepler light curve, with the 6 modes that are listed in Table A.3 indicated by green vertical line segments, and the adopted detection threshold by the horizontal line. The typical 0.22−0.24 μHz splitting is indicated for two pairs of these. Twomore such splittings, involving less significant peaks, are indicated in blue. The broad power humps in the full-length FT reflect the short life times of these modes.
Current usage metrics show cumulative count of Article Views (full-text article views including HTML views, PDF and ePub downloads, according to the available data) and Abstracts Views on Vision4Press platform.
Data correspond to usage on the plateform after 2015. The current usage metrics is available 48-96 hours after online publication and is updated daily on week days.
Initial download of the metrics may take a while.