Free Access
Fig. 1
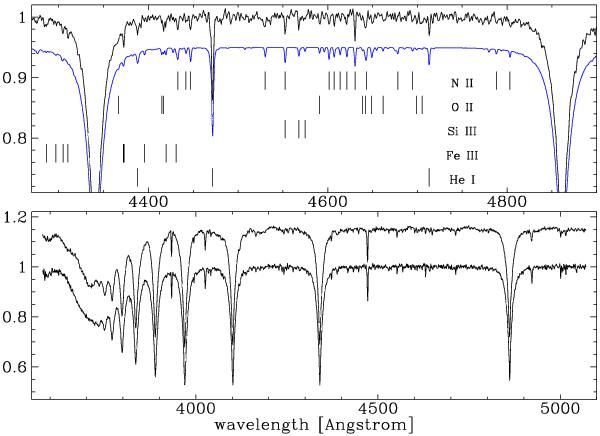
Top: zoom-in of the mean WHT spectrum with the NLTE fit and line identifications, demonstrating some of the stronger lines of heavier elements. The fit is offset for clarity. Bottom: mean spectrum from the WHT (bottom) and NOT, offset in flux for clarity.
This figure is made of several images, please see below:
Current usage metrics show cumulative count of Article Views (full-text article views including HTML views, PDF and ePub downloads, according to the available data) and Abstracts Views on Vision4Press platform.
Data correspond to usage on the plateform after 2015. The current usage metrics is available 48-96 hours after online publication and is updated daily on week days.
Initial download of the metrics may take a while.