Fig. 9
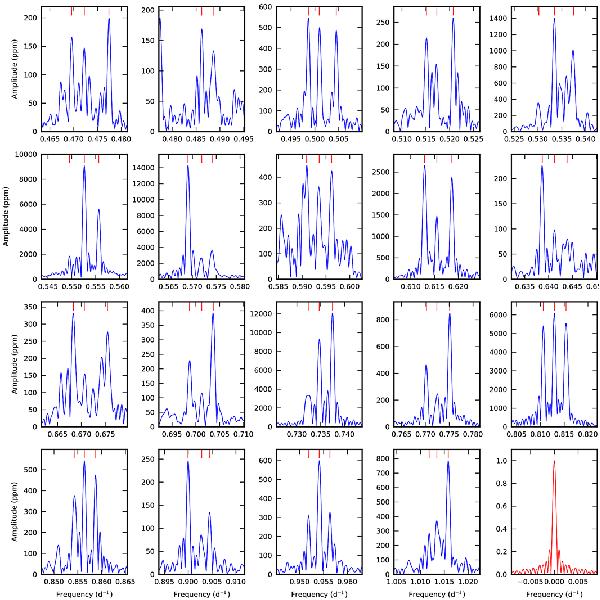
All rotationally split modes in the Scargle periodogram (blue solid line) of KIC 10526294, ranging from barely detectable and strongly asymmetric to strong and very clear cases, covering a broad frequency range. Each subplot is centred on the central (m = 0, fj) peak, has the same horizontal scale, and all signal from outside the plotted intervals is prewhitened. Frequencies identified as members of rotationally split triplets (from Table 4) are marked with red markers on the top of each subplot. The window function of the data is plotted in the lower right panel for comparison (using a red solid line), scaled to have a maximum amplitude of unity.
Current usage metrics show cumulative count of Article Views (full-text article views including HTML views, PDF and ePub downloads, according to the available data) and Abstracts Views on Vision4Press platform.
Data correspond to usage on the plateform after 2015. The current usage metrics is available 48-96 hours after online publication and is updated daily on week days.
Initial download of the metrics may take a while.