Fig. 8
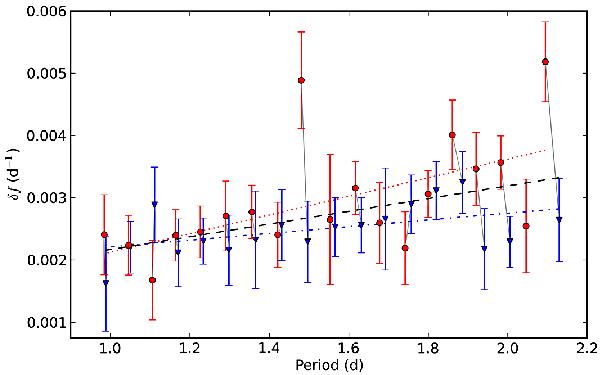
The rotational splitting values (red filled circles for fj + and blue filled triangles for fj −) from the periodogram of KIC 10526294. Splittings connected to the same central (m = 0, fj) peak are connected with a solid light grey line. Linear fits are plotted for the m = −1 peaks (dot-dashed blue line), the m = + 1 peaks (dotted red line), and the combined dataset (dashed black line).
Current usage metrics show cumulative count of Article Views (full-text article views including HTML views, PDF and ePub downloads, according to the available data) and Abstracts Views on Vision4Press platform.
Data correspond to usage on the plateform after 2015. The current usage metrics is available 48-96 hours after online publication and is updated daily on week days.
Initial download of the metrics may take a while.