Fig. 5
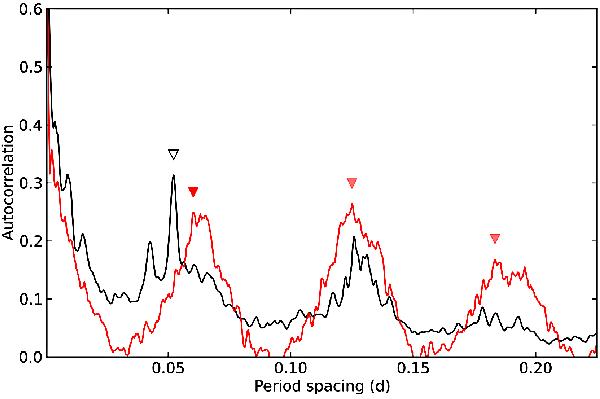
Autocorrelation function (in period space) of the original Scargle periodogram (black solid line) and of a modified periodogram where the 346 significant frequencies were given an artificial power, while all others were given zero power (red solid line), both calculated from the frequency range of 0.15 d-1 to 1.1 d-1. Candidate spacings are marked with triangles using a colour according to the corresponding function. See text for further explanation.
Current usage metrics show cumulative count of Article Views (full-text article views including HTML views, PDF and ePub downloads, according to the available data) and Abstracts Views on Vision4Press platform.
Data correspond to usage on the plateform after 2015. The current usage metrics is available 48-96 hours after online publication and is updated daily on week days.
Initial download of the metrics may take a while.