Fig. 3
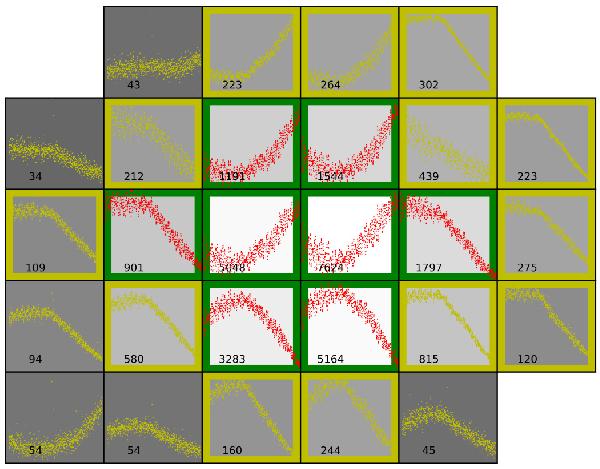
Pixel mask for the Q5 data of KIC 10526294. The light curve is plotted for every individual pixel that was downloaded from the spacecraft. The value in every pixel, as well as the background colour, indicates the S/N of the flux in the pixel. The pixels with green borders were used to extract the standard Kepler light curves. We have added the yellow pixels (significant signal is present) in our custom mask for the light curve extraction. This results in a light curve with significantly less instrumental effects than the standard extraction.
Current usage metrics show cumulative count of Article Views (full-text article views including HTML views, PDF and ePub downloads, according to the available data) and Abstracts Views on Vision4Press platform.
Data correspond to usage on the plateform after 2015. The current usage metrics is available 48-96 hours after online publication and is updated daily on week days.
Initial download of the metrics may take a while.