Fig. 2
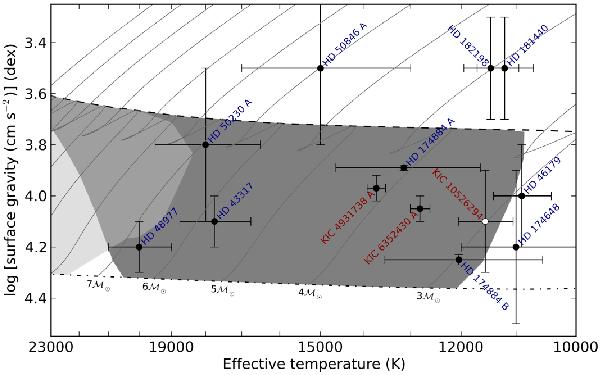
Kiel diagram (log Teff versus log g) of a sample of B-type stars near the main sequence – for which an in-depth analysis was carried out – observed by CoRoT (labelled in dark blue) and by Kepler (labelled in dark red), showing the position of KIC 10526294 (plotted with a white marker). The dot-dashed line represents the zero-age main sequence (ZAMS), while the dashed line represents the terminal-age main sequence (TAMS). The thin grey lines denote evolutionary tracks for selected masses, and the β Cep (light grey) and SPB (dark grey) instability strips (Dziembowski 1977) are also plotted. These were all calculated for Z = 0.015, X = 0.7, using OP opacities (Seaton 2005) and A04 heavy element mixture (Asplund et al. 2005). Other details are the same as in Pamyatnykh (1999). Different error bars reflect differences in data and methodology.
Current usage metrics show cumulative count of Article Views (full-text article views including HTML views, PDF and ePub downloads, according to the available data) and Abstracts Views on Vision4Press platform.
Data correspond to usage on the plateform after 2015. The current usage metrics is available 48-96 hours after online publication and is updated daily on week days.
Initial download of the metrics may take a while.