Fig. 14
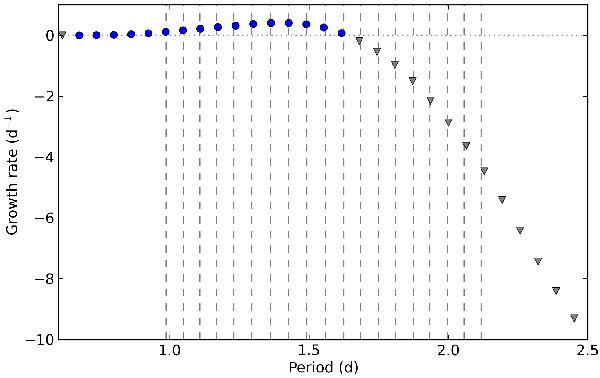
Non-adiabatic stability analysis for the best fitting model. The growth rate of the zonal dipole modes, as defined in Aerts et al. (2010), is plotted as a function of the mode period. Excited modes have positive growth rate and are plotted using blue circles, while stable modes are marked with grey triangles. The position of the observed modes are plotted using grey dashed lines.
Current usage metrics show cumulative count of Article Views (full-text article views including HTML views, PDF and ePub downloads, according to the available data) and Abstracts Views on Vision4Press platform.
Data correspond to usage on the plateform after 2015. The current usage metrics is available 48-96 hours after online publication and is updated daily on week days.
Initial download of the metrics may take a while.