Fig. 13
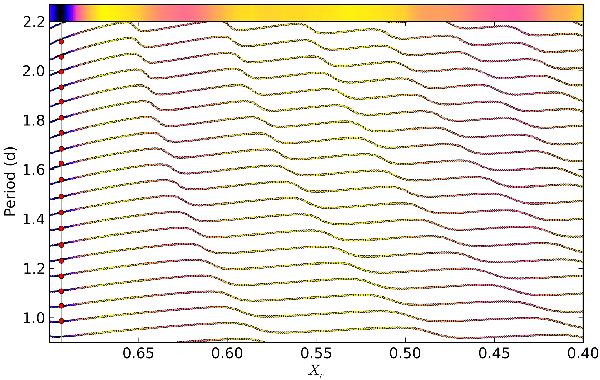
Evolution of the period of the ℓ = 1 gravity modes with decreasing central hydrogen content. The theoretical frequencies were calculated with GYRE in our region of interest along the MESA evolutionary track which holds the best fitting model (ℳ = 3.20 ℳ⊙, Z = 0.020, fov = 0.000). The colour of each model (a set of GYRE frequencies along a vertical line) represents the logarithm of the corresponding χ2 value at the given Xc (using the same colours as Fig. 10). For better visibility, this colour sequence is repeated on the top of the figure. The observed modes are plotted using larger red circles at the position of the best fitting model at Xc = 0.6932 (the error bars on the observed values are smaller than the size of the symbols).
Current usage metrics show cumulative count of Article Views (full-text article views including HTML views, PDF and ePub downloads, according to the available data) and Abstracts Views on Vision4Press platform.
Data correspond to usage on the plateform after 2015. The current usage metrics is available 48-96 hours after online publication and is updated daily on week days.
Initial download of the metrics may take a while.