Fig. 11
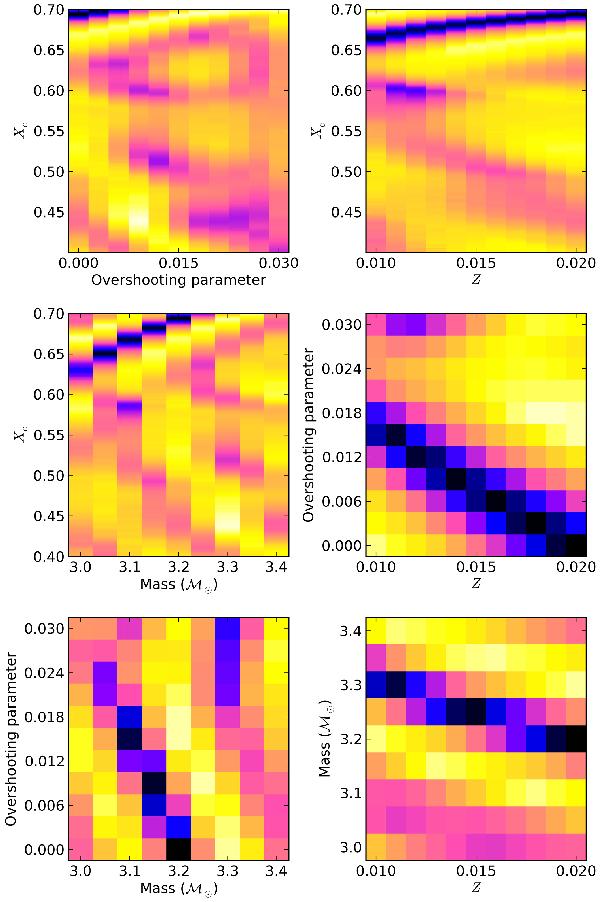
Visualisation of the correlations between all possible pairs of the four free model parameters within the highly structured χ2 space. For each subplot, two of the four parameters were fixed to the value corresponding to the best fit model (number 1 in Table 6), and the χ2 values are plotted in the remaining two-dimensional parameter space using the same colour coding as Fig. 10. For further details, see explanation in the text.
Current usage metrics show cumulative count of Article Views (full-text article views including HTML views, PDF and ePub downloads, according to the available data) and Abstracts Views on Vision4Press platform.
Data correspond to usage on the plateform after 2015. The current usage metrics is available 48-96 hours after online publication and is updated daily on week days.
Initial download of the metrics may take a while.