Fig. 10
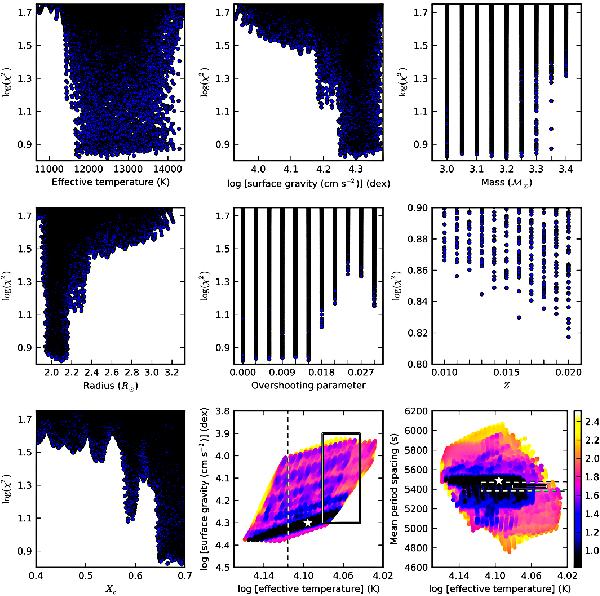
Visualisation of the resulting χ2 space from the multi-dimensional grid search using the high-resolution MESA/GYRE grid. The first seven panels (from left to right and top to bottom) show the dependence of the χ2 value on effective temperature, surface gravity, mass, radius, overshooting, metallicity, and central hydrogen content of the corresponding model. The last two panels show the χ2 distribution of the model points over the Kiel diagram, and over a log Teff versus measured average period spacing diagram. The colour of each symbol represents the logarithm of the corresponding χ2 value. The 1-σ and 3-σ error boxes of KIC 10526294 in log Teff, log g, and mean period spacing are plotted using solid and dashed lines, respectively. The position of the best model is marked with a white asterisk. For further details, see explanation in the text.
Current usage metrics show cumulative count of Article Views (full-text article views including HTML views, PDF and ePub downloads, according to the available data) and Abstracts Views on Vision4Press platform.
Data correspond to usage on the plateform after 2015. The current usage metrics is available 48-96 hours after online publication and is updated daily on week days.
Initial download of the metrics may take a while.