Fig. 1
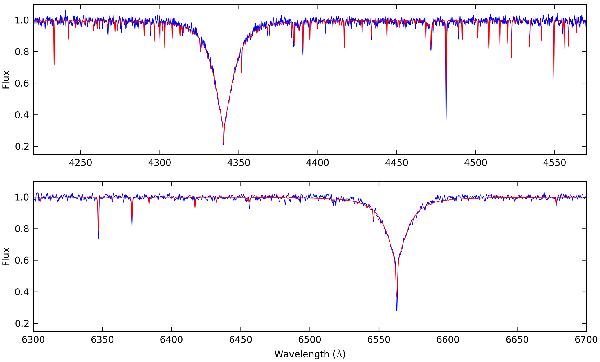
Comparison of rectified observed, and synthetic spectra for two selected wavelength regions of KIC 10526294. In each panel, the observed ISIS spectrum is plotted with a blue solid line, and the synthetic spectrum is plotted with a red solid line.
Current usage metrics show cumulative count of Article Views (full-text article views including HTML views, PDF and ePub downloads, according to the available data) and Abstracts Views on Vision4Press platform.
Data correspond to usage on the plateform after 2015. The current usage metrics is available 48-96 hours after online publication and is updated daily on week days.
Initial download of the metrics may take a while.