Fig. 7
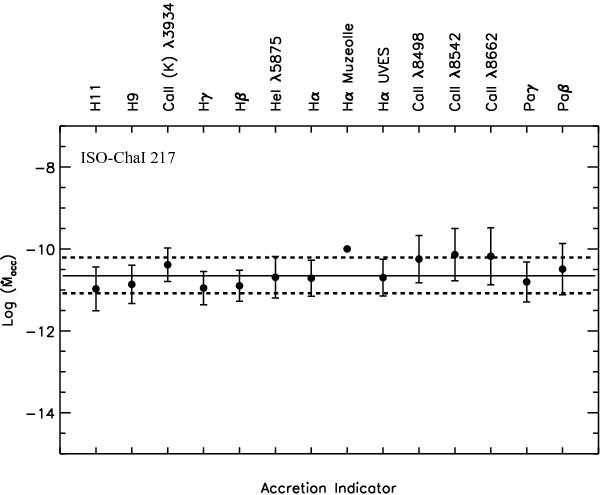
Mass accretion rate estimated from various accretion tracers. The solid line gives the mean value of log (Ṁacc) and the dashed line is the ±1σ uncertainty. The errors on the individual measurements mainly come from the error in the line fluxes and in the value of the on-source extinction. The value of Ṁacc calculated by Muzerolle et al. (2005) from modelling of the Hα line and from the UVES spectra presented by Whelan et al. (2009b) are included here for comparison. No error estimates were given in Muzerolle et al. (2005).
Current usage metrics show cumulative count of Article Views (full-text article views including HTML views, PDF and ePub downloads, according to the available data) and Abstracts Views on Vision4Press platform.
Data correspond to usage on the plateform after 2015. The current usage metrics is available 48-96 hours after online publication and is updated daily on week days.
Initial download of the metrics may take a while.