Fig. 5
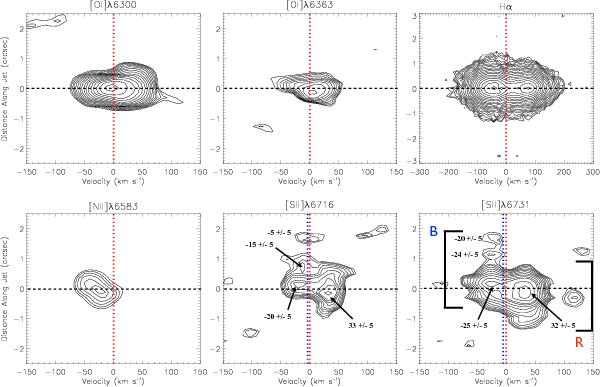
Contour plots for the main emission lines. Velocities are with respect to the systemic velocity of the source. The zero spatial position is the centre of the continuum emission, measured using Gaussian fitting, and is taken to be the source position. For the [O i] λλ6300,6363 and Hα lines, contours start at 3σ and for the [N ii] λ6583 and [S ii] λλ6716,6731 lines they start at 2σ. The 1σ value is 1 × 10-18 erg/s/cm2. This is done to highlight the presence of faint extended blue-shifted [S ii] emission and the non-detection of even fainter red-shifted [N ii]λ6583 emission. In all cases, contours increase with a log scale ( for the [N ii] and [S ii] lines). The blue dashed lines mark the velocity of the faint [Sii]λ6716, 6731 background lines.
Current usage metrics show cumulative count of Article Views (full-text article views including HTML views, PDF and ePub downloads, according to the available data) and Abstracts Views on Vision4Press platform.
Data correspond to usage on the plateform after 2015. The current usage metrics is available 48-96 hours after online publication and is updated daily on week days.
Initial download of the metrics may take a while.