Fig. 6
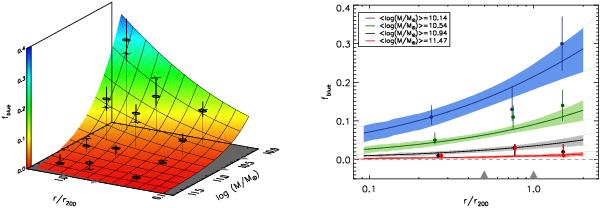
Dependence of fblue on galaxy stellar mass M and cluster-centric distance r/r200. Here the model includes only a dependence on M and r/r200 (i.e., as Eq. (2), without the Q-related term). Left panel: thick circles with error bars represent the stacked data and the 68% confidence interval. The colour-coded surface represents the fitted model (mean value of the posterior distribution at each [x, y] locus). The model value of fblue at the [x, y] locus of each stacked data is symbolised by a cross. Right panel: data points with error bars represent the stacked data (slightly shifted along the x-axis for clarity). Solid lines and shaded areas represent the posterior mean and error of the model of Eq. (2). The fit is performed on the 204 individual fblue measurements.
Current usage metrics show cumulative count of Article Views (full-text article views including HTML views, PDF and ePub downloads, according to the available data) and Abstracts Views on Vision4Press platform.
Data correspond to usage on the plateform after 2015. The current usage metrics is available 48-96 hours after online publication and is updated daily on week days.
Initial download of the metrics may take a while.