Fig. 3
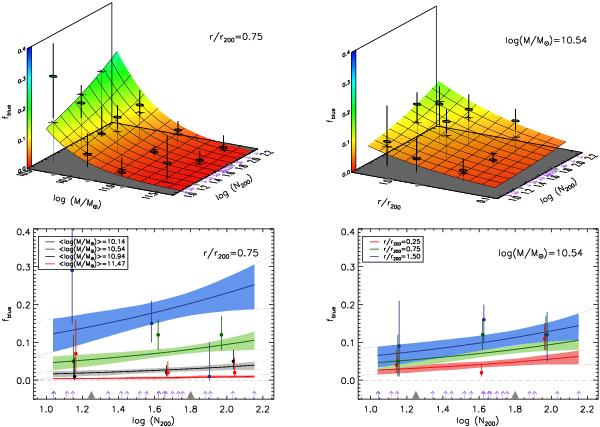
Two-dimensional slice/view of the six-dimensional parameter space describing the dependence of the quenching rate on galaxy and cluster properties. The figures consider the following quantities: cluster richness log(N200), galaxy stellar mass M, and cluster-centric distance r/r200. The fit is performed on the 204 individual fblue measurements. Symbols are similar to those in Fig. 2.
Current usage metrics show cumulative count of Article Views (full-text article views including HTML views, PDF and ePub downloads, according to the available data) and Abstracts Views on Vision4Press platform.
Data correspond to usage on the plateform after 2015. The current usage metrics is available 48-96 hours after online publication and is updated daily on week days.
Initial download of the metrics may take a while.