Free Access
Fig. 8
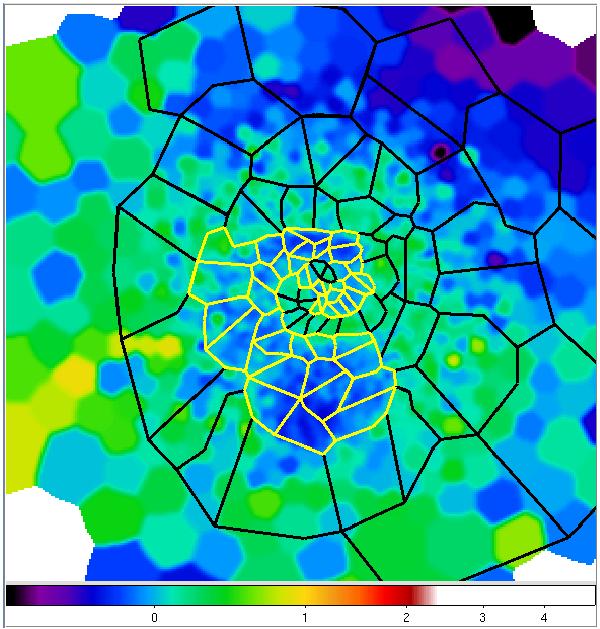
Entropy residual map with polygons used for the spectral analysis. Yellow labels the IN and black the OUT polygons. The entropy map is the same as in Fig. 4 with the color scale adjusted so that blue regions have negative residual entropy and green regions positive residual entropy values.
Current usage metrics show cumulative count of Article Views (full-text article views including HTML views, PDF and ePub downloads, according to the available data) and Abstracts Views on Vision4Press platform.
Data correspond to usage on the plateform after 2015. The current usage metrics is available 48-96 hours after online publication and is updated daily on week days.
Initial download of the metrics may take a while.