Free Access
Fig. 4
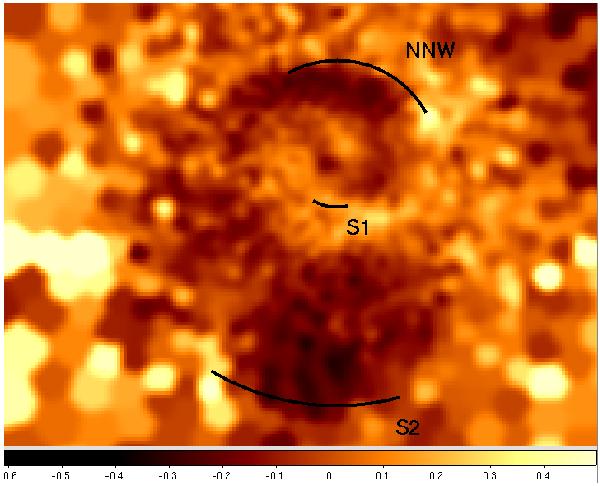
Entropy residual map. Black arcs mark the detected cold fronts. The residual entropy is zero in regions whose the entropy equals the averaged entropy; darker regions (negative values) have low entropy levels, lighter regions (positive values) have an entropy excess with respect to the average.
Current usage metrics show cumulative count of Article Views (full-text article views including HTML views, PDF and ePub downloads, according to the available data) and Abstracts Views on Vision4Press platform.
Data correspond to usage on the plateform after 2015. The current usage metrics is available 48-96 hours after online publication and is updated daily on week days.
Initial download of the metrics may take a while.