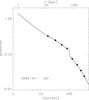
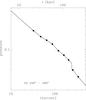
Fig. B.1

Pressure (arbitrary units) profiles obtained with the two different methods (see text) in the three cold-front sectors 30° − 75° (left panel), 75° − 120° (middle panel) and 240° − 285° (right panel). The solid line is the pressure profile obtained by using the interpolated temperature profile, filled black circles correspond to the pressure obtained by using the original T profile.

Current usage metrics show cumulative count of Article Views (full-text article views including HTML views, PDF and ePub downloads, according to the available data) and Abstracts Views on Vision4Press platform.
Data correspond to usage on the plateform after 2015. The current usage metrics is available 48-96 hours after online publication and is updated daily on week days.
Initial download of the metrics may take a while.