Free Access
Fig. 1
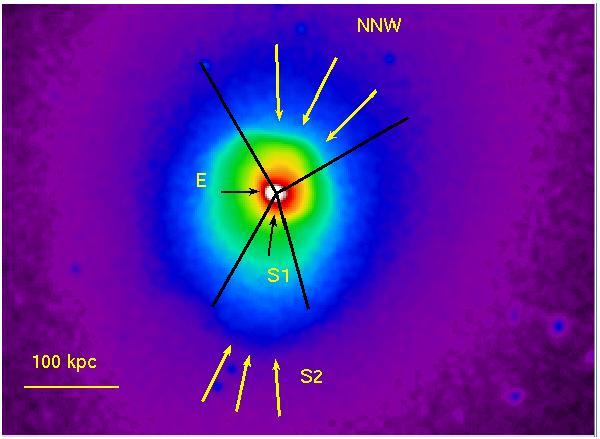
EPIC surface brightness image in the energy range 0.4−2 keV. Black lines define the sectors that host cold fronts (see text for further details). Black arrows mark the position of the inner cold fronts (labeled E and S1) and yellow arrows the positions of the outermost cold fronts (labeled NNW and S2).
Current usage metrics show cumulative count of Article Views (full-text article views including HTML views, PDF and ePub downloads, according to the available data) and Abstracts Views on Vision4Press platform.
Data correspond to usage on the plateform after 2015. The current usage metrics is available 48-96 hours after online publication and is updated daily on week days.
Initial download of the metrics may take a while.