Fig. 7
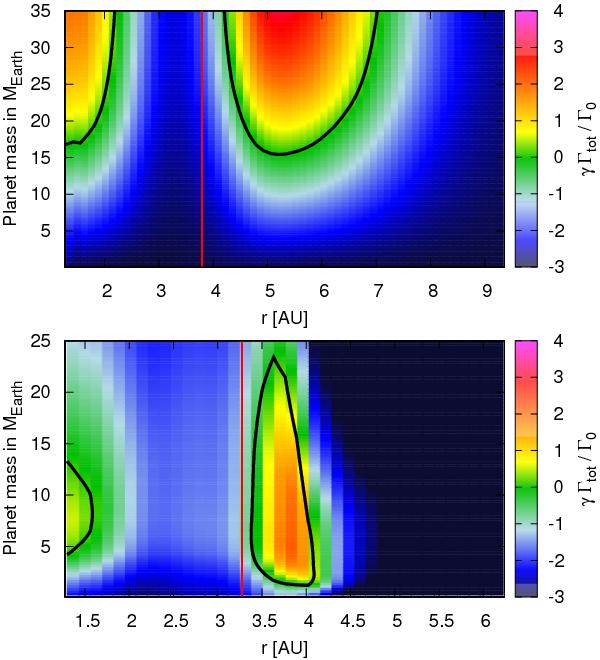
Migration map for discs without (top) and with (bottom) an α transition. The encircled regions in black mark regions in which outward migration is possible. The vertical red line marks the ice line at 190 K in both plots. The two plots feature slightly different radial extensions and planetary masses.
Current usage metrics show cumulative count of Article Views (full-text article views including HTML views, PDF and ePub downloads, according to the available data) and Abstracts Views on Vision4Press platform.
Data correspond to usage on the plateform after 2015. The current usage metrics is available 48-96 hours after online publication and is updated daily on week days.
Initial download of the metrics may take a while.