Fig. 4
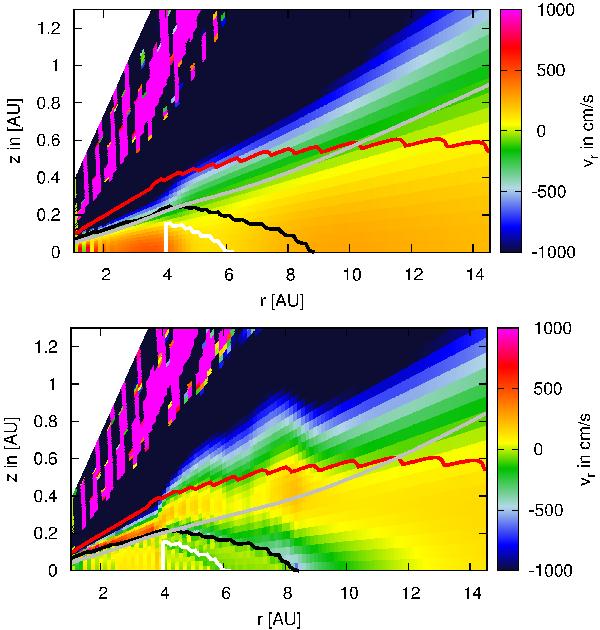
Radial velocity of the disc without α transition (top) and with α transition (bottom). The black and white lines mark the transitions in the α viscosity parameter as defined by Eq. (3) and as shown in Fig. 1. In the bottom panel, the parts of the disc above the red line are fully active with αA. They are overplotted in the top plot as well to show where these transitions would be. The grey line represents the pressure scale-height H. Positive velocities mark an outward motion, while negative velocities indicate an inward motion.
Current usage metrics show cumulative count of Article Views (full-text article views including HTML views, PDF and ePub downloads, according to the available data) and Abstracts Views on Vision4Press platform.
Data correspond to usage on the plateform after 2015. The current usage metrics is available 48-96 hours after online publication and is updated daily on week days.
Initial download of the metrics may take a while.