Fig. 10
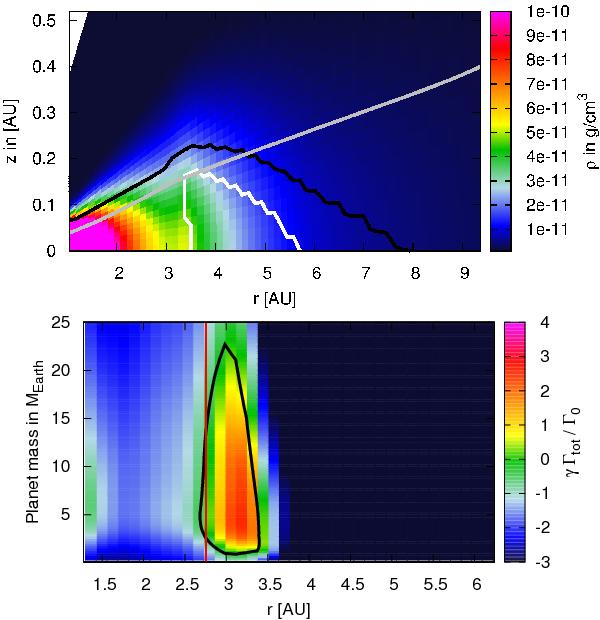
Density (top) and migration map (bottom) of the Ṁ = 5 × 10⁻⁸ M⊙/yr disc with a lower penetration depth for cosmic rays. In the top plot, the black and white lines mark the transitions in the α viscosity parameter as defined by Eq. (12), the grey line marks the disc’s height H. In the bottom plot, the regions encircled in black enclose the regions of outward migration, while the vertical red line marks the ice line at 190 K.
Current usage metrics show cumulative count of Article Views (full-text article views including HTML views, PDF and ePub downloads, according to the available data) and Abstracts Views on Vision4Press platform.
Data correspond to usage on the plateform after 2015. The current usage metrics is available 48-96 hours after online publication and is updated daily on week days.
Initial download of the metrics may take a while.