Fig. 6
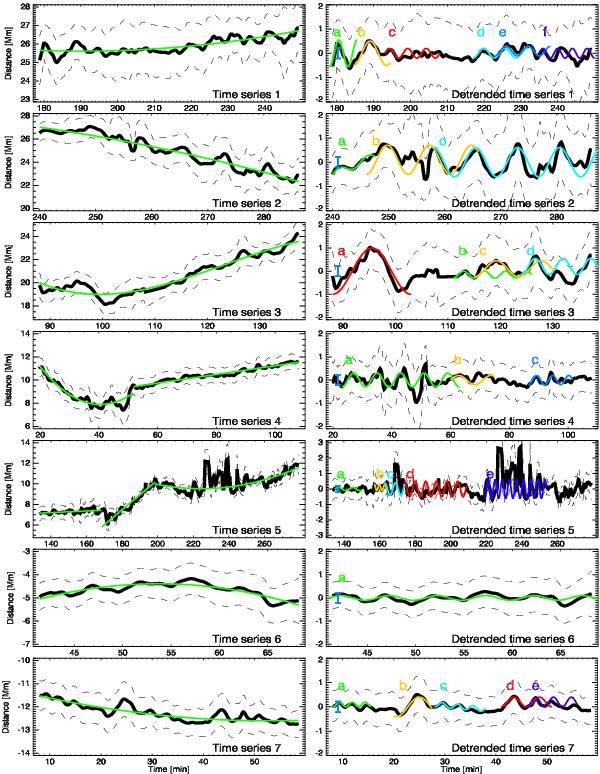
Time series of the loop displacements extracted by a Gaussian fitting from the TD map at 171 Å of Fig. 5. The original time series are shown on the left. The dashed lines trace the loop boundaries and are estimated from the σ of the Gaussian fitting. The overall series are fitted with one or more low-degree polynomial functions (i.e. linear, quadratic, etc.) in order to determine their global trend, which has been removed in the right plots. A blue error bar in the right column of plots is shown in order to compare the amplitude of oscillations with the AIA spatial resolution (~0.4 Mm).
Current usage metrics show cumulative count of Article Views (full-text article views including HTML views, PDF and ePub downloads, according to the available data) and Abstracts Views on Vision4Press platform.
Data correspond to usage on the plateform after 2015. The current usage metrics is available 48-96 hours after online publication and is updated daily on week days.
Initial download of the metrics may take a while.