Fig. A.1
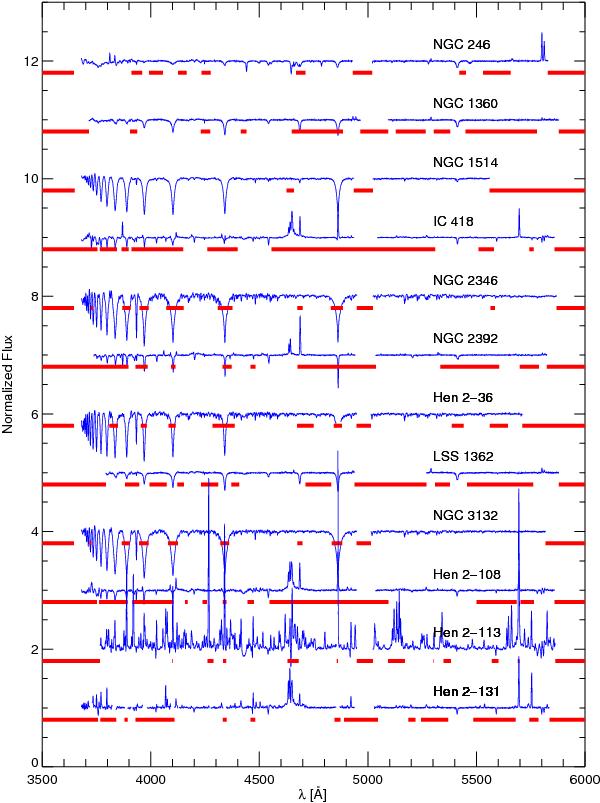
Normalized FORS 2 Stokes I spectra of the 12 central stars in our sample, displayed with a vertical offset of 1 unit between adjacent spectra. For each object, the displayed spectra (blue) define wavelength set all (entire spectrum), gaps indicating the excluded regions, while wavelength set star (clean stellar lines only) is obtained by excluding the regions marked by the (red) horizontal bars 0.2 units below the respective stellar continuum.
Current usage metrics show cumulative count of Article Views (full-text article views including HTML views, PDF and ePub downloads, according to the available data) and Abstracts Views on Vision4Press platform.
Data correspond to usage on the plateform after 2015. The current usage metrics is available 48-96 hours after online publication and is updated daily on week days.
Initial download of the metrics may take a while.