Fig. 1
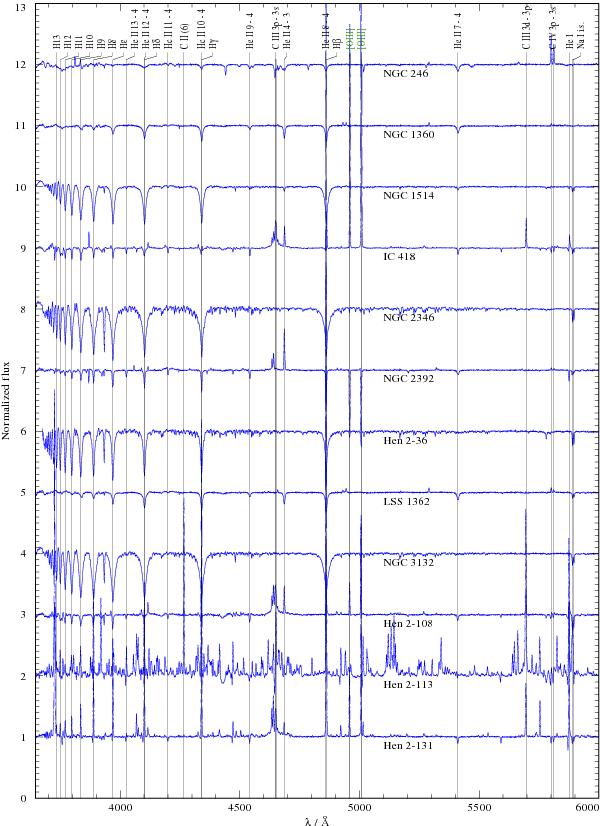
Normalized FORS 2 Stokes I spectra of the 12 central stars in our sample, displayed with a vertical offset of 1 unit between adjacent spectra. The strongest spectral lines are identified. The forbidden [O iii] nebular emission lines close to 5000 Å are marked in green. They may appear in absorption (e.g., NGC 2392) due to imperfect background subtraction.
Current usage metrics show cumulative count of Article Views (full-text article views including HTML views, PDF and ePub downloads, according to the available data) and Abstracts Views on Vision4Press platform.
Data correspond to usage on the plateform after 2015. The current usage metrics is available 48-96 hours after online publication and is updated daily on week days.
Initial download of the metrics may take a while.