Fig. 5
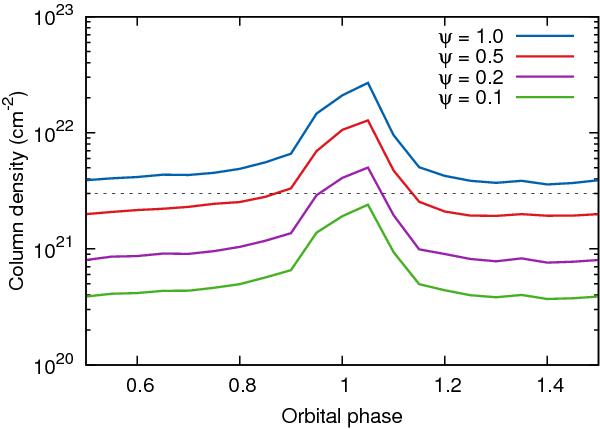
Column density as a function of orbital phase computed from the X-ray radiative transfer calculations. The different curves corresponds to different reduction factors for the wind mass-loss rates. The horizontal dashed line in the column density plot corresponds to the best-fit value of 3 × 1021 cm-2 attained by Nazé et al. (2012b) for phases close to periastron.
Current usage metrics show cumulative count of Article Views (full-text article views including HTML views, PDF and ePub downloads, according to the available data) and Abstracts Views on Vision4Press platform.
Data correspond to usage on the plateform after 2015. The current usage metrics is available 48-96 hours after online publication and is updated daily on week days.
Initial download of the metrics may take a while.