Fig. 3
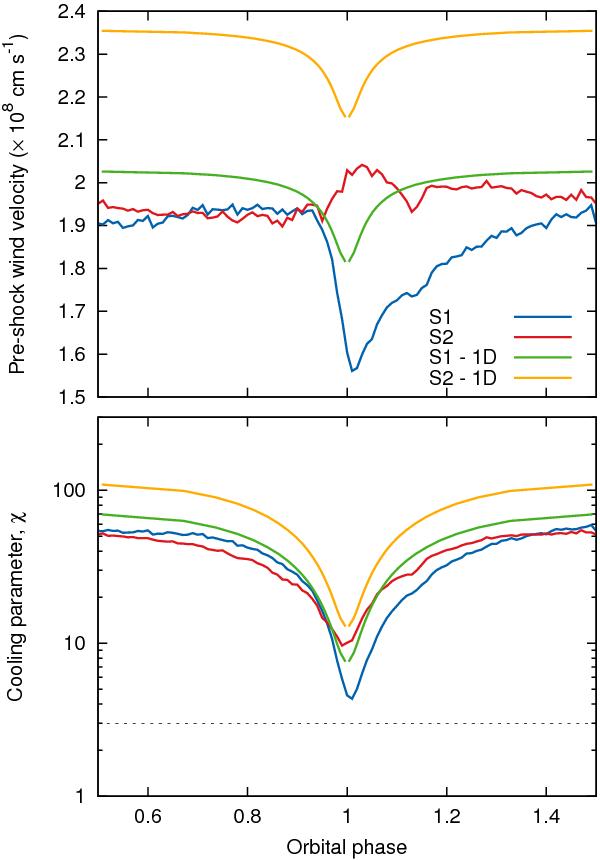
Pre-shock velocities (upper panel) and post-shock cooling parameters (lower panel) derived from the 3D hydrodynamic simulation. For comparison, curves are shown for one-dimensional static-star model estimates (which include wind acceleration and the radiation fields of both stars). The dashed line in the lower panel corresponds to χ = 3; when χ ≲ 3 gas cools effectively within the post-shock region where emission predominantly originates from.
Current usage metrics show cumulative count of Article Views (full-text article views including HTML views, PDF and ePub downloads, according to the available data) and Abstracts Views on Vision4Press platform.
Data correspond to usage on the plateform after 2015. The current usage metrics is available 48-96 hours after online publication and is updated daily on week days.
Initial download of the metrics may take a while.